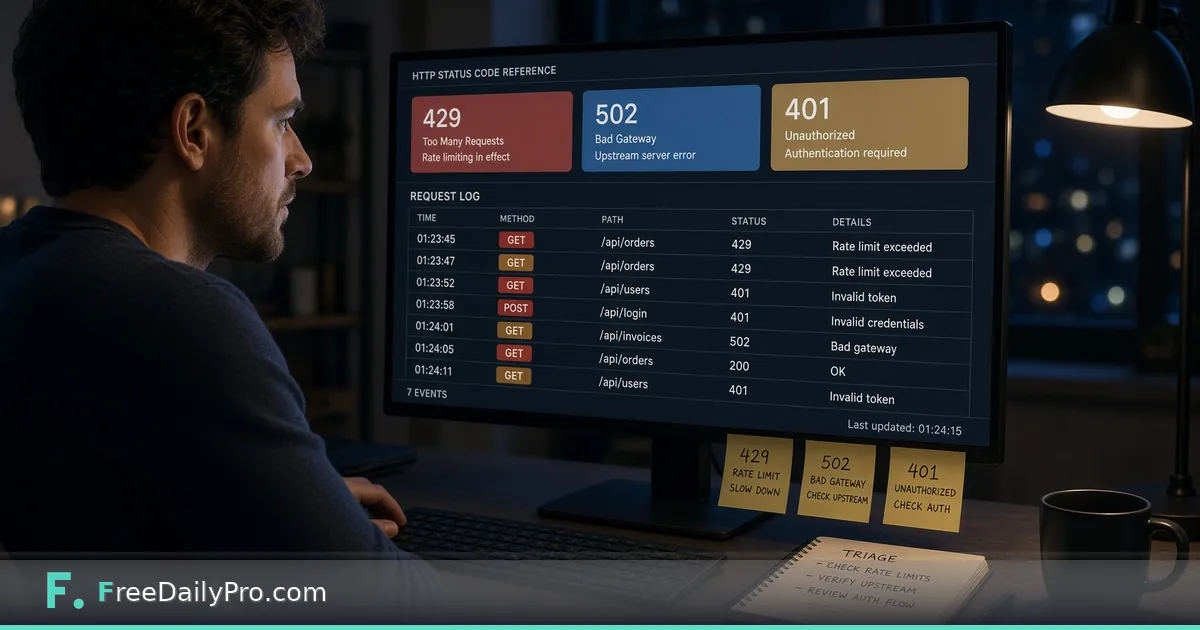
Triage a Burst of 429, 502 and 401 Errors With a Lookup
Work through an API incident by reading status codes by category, separating client faults from server faults, and searching the reference fast.
It is late on a Friday and the log tail shows a wall of numbers: a few hundred 429s, a cluster of 502s, and a trickle of 401s from one customer. Before anyone says "the API is down", you want to know which of these are your fault, which are the provider's, and which need nothing at all. HTTP Status Reference is a searchable list of codes with a plain description and, for errors, a suggested next step.
The clip below shows how the lookup works.

Start with the first digit
The first digit sorts almost everything. 2xx means success, 3xx means the client is being sent somewhere else, 4xx means the request itself was the problem, and 5xx means the server failed to handle a request that looked reasonable. In the tool, every code carries one of five category labels: Informational, Success, Redirection, Client Error and Server Error, with a colour for each.
That sorting tells you who should act. In the Friday scenario, the 429s and 401s are 4xx, so something about how requests are sent needs to change on your side. The 502s are 5xx, so something upstream of your caller broke. Different people own those fixes, and splitting the log that way takes one minute.
Using the search box
The search field matches three things: the code number, the name, and the category. Typing 429 shows Too Many Requests. Typing "gateway" shows 502 and 504. Typing "client error" lists every 4xx entry, which is handy when you have a code you cannot remember but know roughly what family it is in. Matching is partial, so typing 40 lists 400 through 409, and a fragment like "time" finds both Request Timeout and Gateway Timeout.
Nothing is sent anywhere. The list is built into the page, so lookups are instant and you can keep the tool open next to a terminal while you work.
Working through the incident
Take the three groups in turn.
The 429s. The entry says the client has sent too many requests in a given time, and the suggested step is to check the Retry-After header and slow down. Do the arithmetic before changing anything. If the provider allows 10 requests per second and a batch job fires 50 per second, about 40 of every 50 are rejected, which is 80 percent. A retry loop that fires again immediately makes the rejected share worse, not better. Read the Retry-After value on a failing response; if it says 30, the client should wait 30 seconds, not retry in 100 milliseconds. Where no header exists, back off in growing steps such as 1, 2, 4, 8 and 16 seconds with a little random jitter so many workers do not retry in lockstep, and cap the total number of attempts.
The 502s. Bad Gateway means a server acting as a gateway got an invalid response from something behind it. The tool points you to the health of that upstream service. Your request was probably fine. Check the proxy or load balancer logs and the service behind it, and compare with 503 (temporarily overloaded or in maintenance, again with Retry-After to respect) and 504 (the upstream took too long, so look at its performance rather than your payload).
The 401s. Unauthorized means credentials are missing, wrong or expired. The suggested step is to verify the token or key and whether it has expired. If the credential is a JWT, decode it in JWT Decoder and compare the expiry claim with the time of the failures. A cluster from one customer often means one expired token rather than a platform problem. Compare with 403 Forbidden, where the credential is valid but lacks permission, so checking roles and scopes helps and re-logging in does not.
Pairs that people confuse
- 401 and 403. Not authenticated versus authenticated but not allowed.
- 400 and 422. Bad Request is a malformed request such as broken JSON; Unprocessable Content is well-formed but fails validation, so look for the field-level message in the body. If the body is hard to read, paste it into JSON / YAML Formatter.
- 404 and 410. Not found versus intentionally removed. Update links for a 410 instead of waiting for the page to return.
- 301 and 308. Both mean moved permanently, but 308 requires the request method to stay the same, so a POST remains a POST. The same split exists between 302 and 307 for temporary moves.
- 409. The request conflicts with the current state, such as a duplicate; refetch before retrying.
- 500. A generic catch-all. The tool says the cause lives in server-side logs, not in anything you can see in the request.
A short checklist for a noisy log
- Group by first digit and count each family.
- Search the three most frequent codes in the tool and read the suggested step.
- For 4xx, pick one failing request and inspect its headers and body: authentication, rate-limit headers, payload shape.
- For 5xx, check the layer named in the description: gateway, upstream or application.
- Note the Retry-After values you see and set client waits to match.
- After the fix, watch whether each family shrinks; a 429 count that stays flat means the retry logic is still too eager.
Mistakes to avoid
- Treating every 5xx as the provider's problem. A request that reliably triggers a 500 may still be your input.
- Retrying 4xx errors automatically. Except for 429, and sometimes 408, repeating an invalid request just repeats the failure.
- Ignoring unusual codes. Reserved or joke entries exist, such as 418 from the coffee-pot specification in RFC 2324, and the tool says plainly that it is not a real error to handle.
- Reading a code without the body. Many APIs return a JSON message that explains the reason in more detail than the number does.
Keep it handy
The reference is a lookup, not a monitoring system: it explains what a code means, and you supply the evidence from your logs. Bookmark it with the rest of the security tools you use during an incident.
Which status code do you look up most often, and what would make the explanation more useful? Tell us on the contact page.